.png)
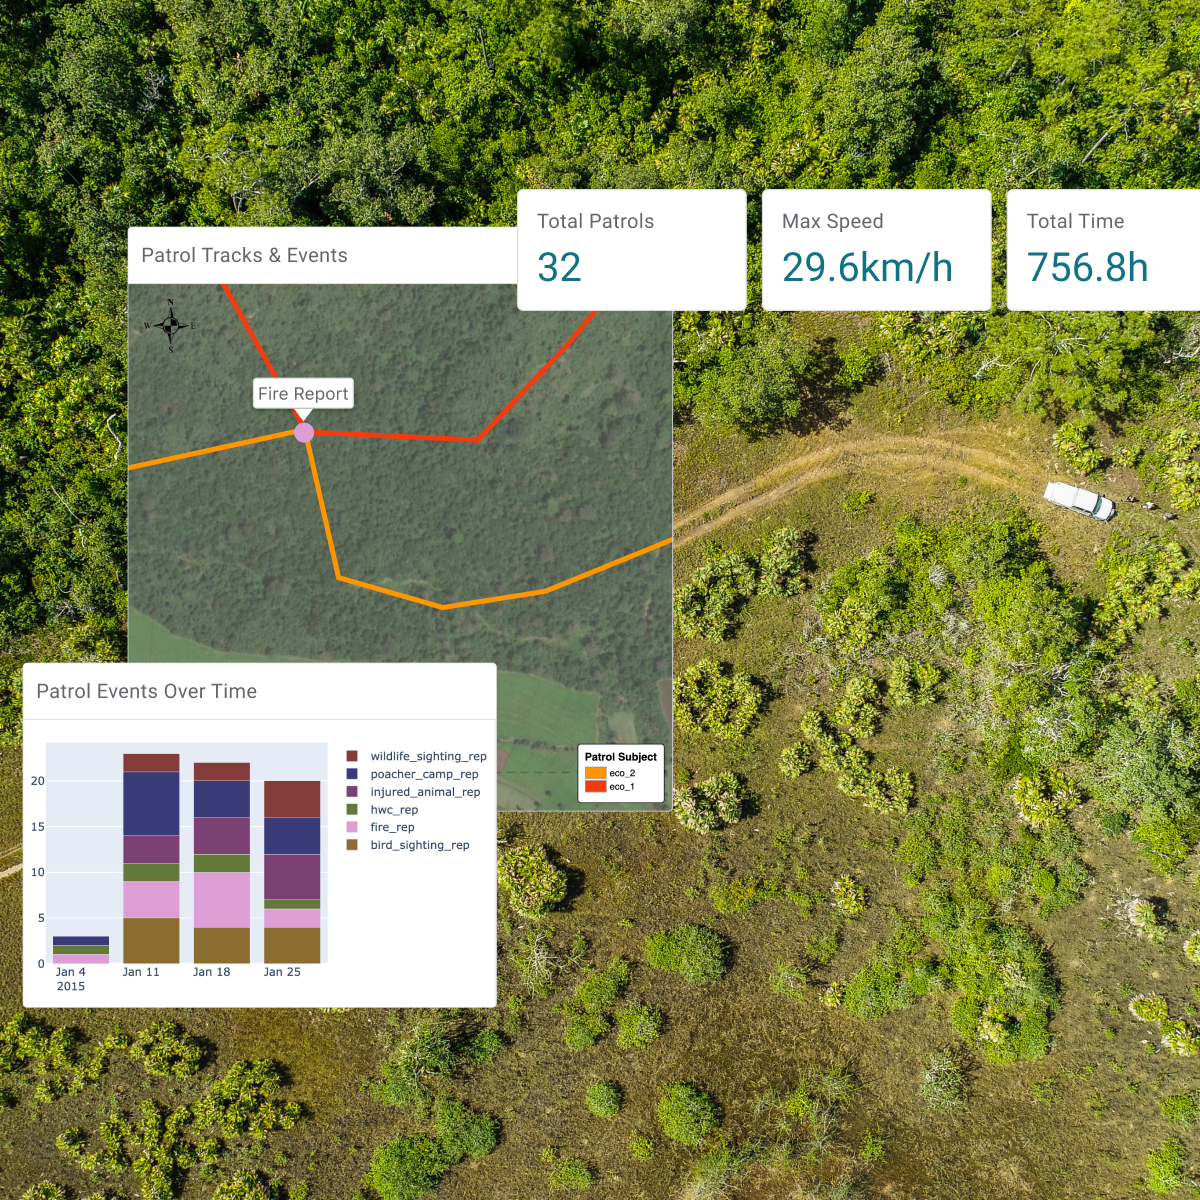
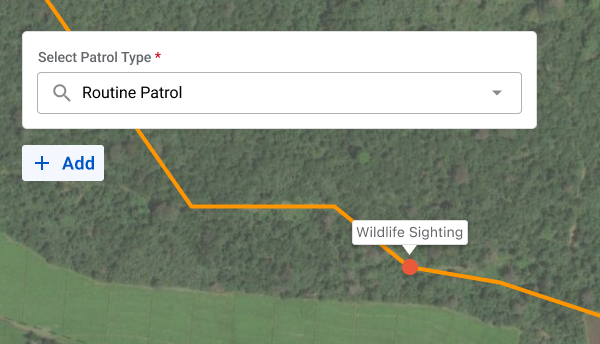
Ecoscope automatically pulls in subject, patrol, and event data, runs the calculations, and produces visualizations—simplifying analysis whether you’re working with months or years of information.
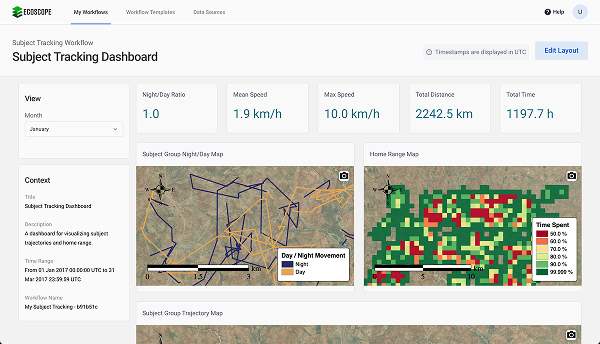
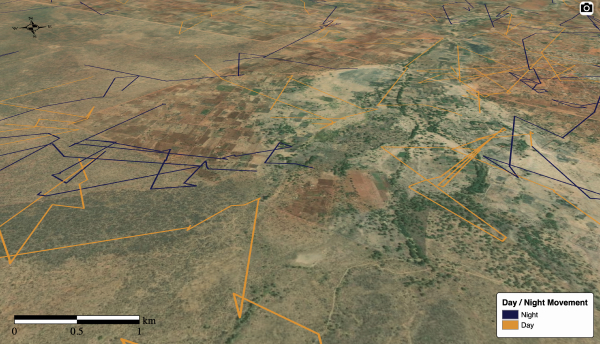
Dynamic maps (zoom, pan, 3D rotation), charts, and widgets transform raw data into patterns revealing movement, coverage, and speed so teams can monitor trends and spot risks quickly.
Run advanced analyses on your own with centralized reporting that reduces duplication and delivers consistent outputs trusted for monthly reports and long-term tracking.

